
By Hernan Lopez.
Companies mentioned: Comcast, Meta, NBCUniversal, Netflix, Paramount, Spotify, TikTok, Warner Bros. Discovery, YouTube
Questions answered: Where did engagement actually go in Q2? Why is Netflix trading two standard deviations below its two-year P/E average ratio? How many Netflix titles crossed 200 million monthly viewing hours in the first half? Which two of the Streaming Eight do I expect to raise guidance?
Special note: This is a public version of the Streamonomics® newsletter. I send an exclusive version to clients one day in advance, which includes more in-depth analysis, access to Owl & Co proprietary research, and opinions not included in the public version. If you work for an Owl & Co client (or would like to become one), just reply.
“What’s going on at Netflix?”
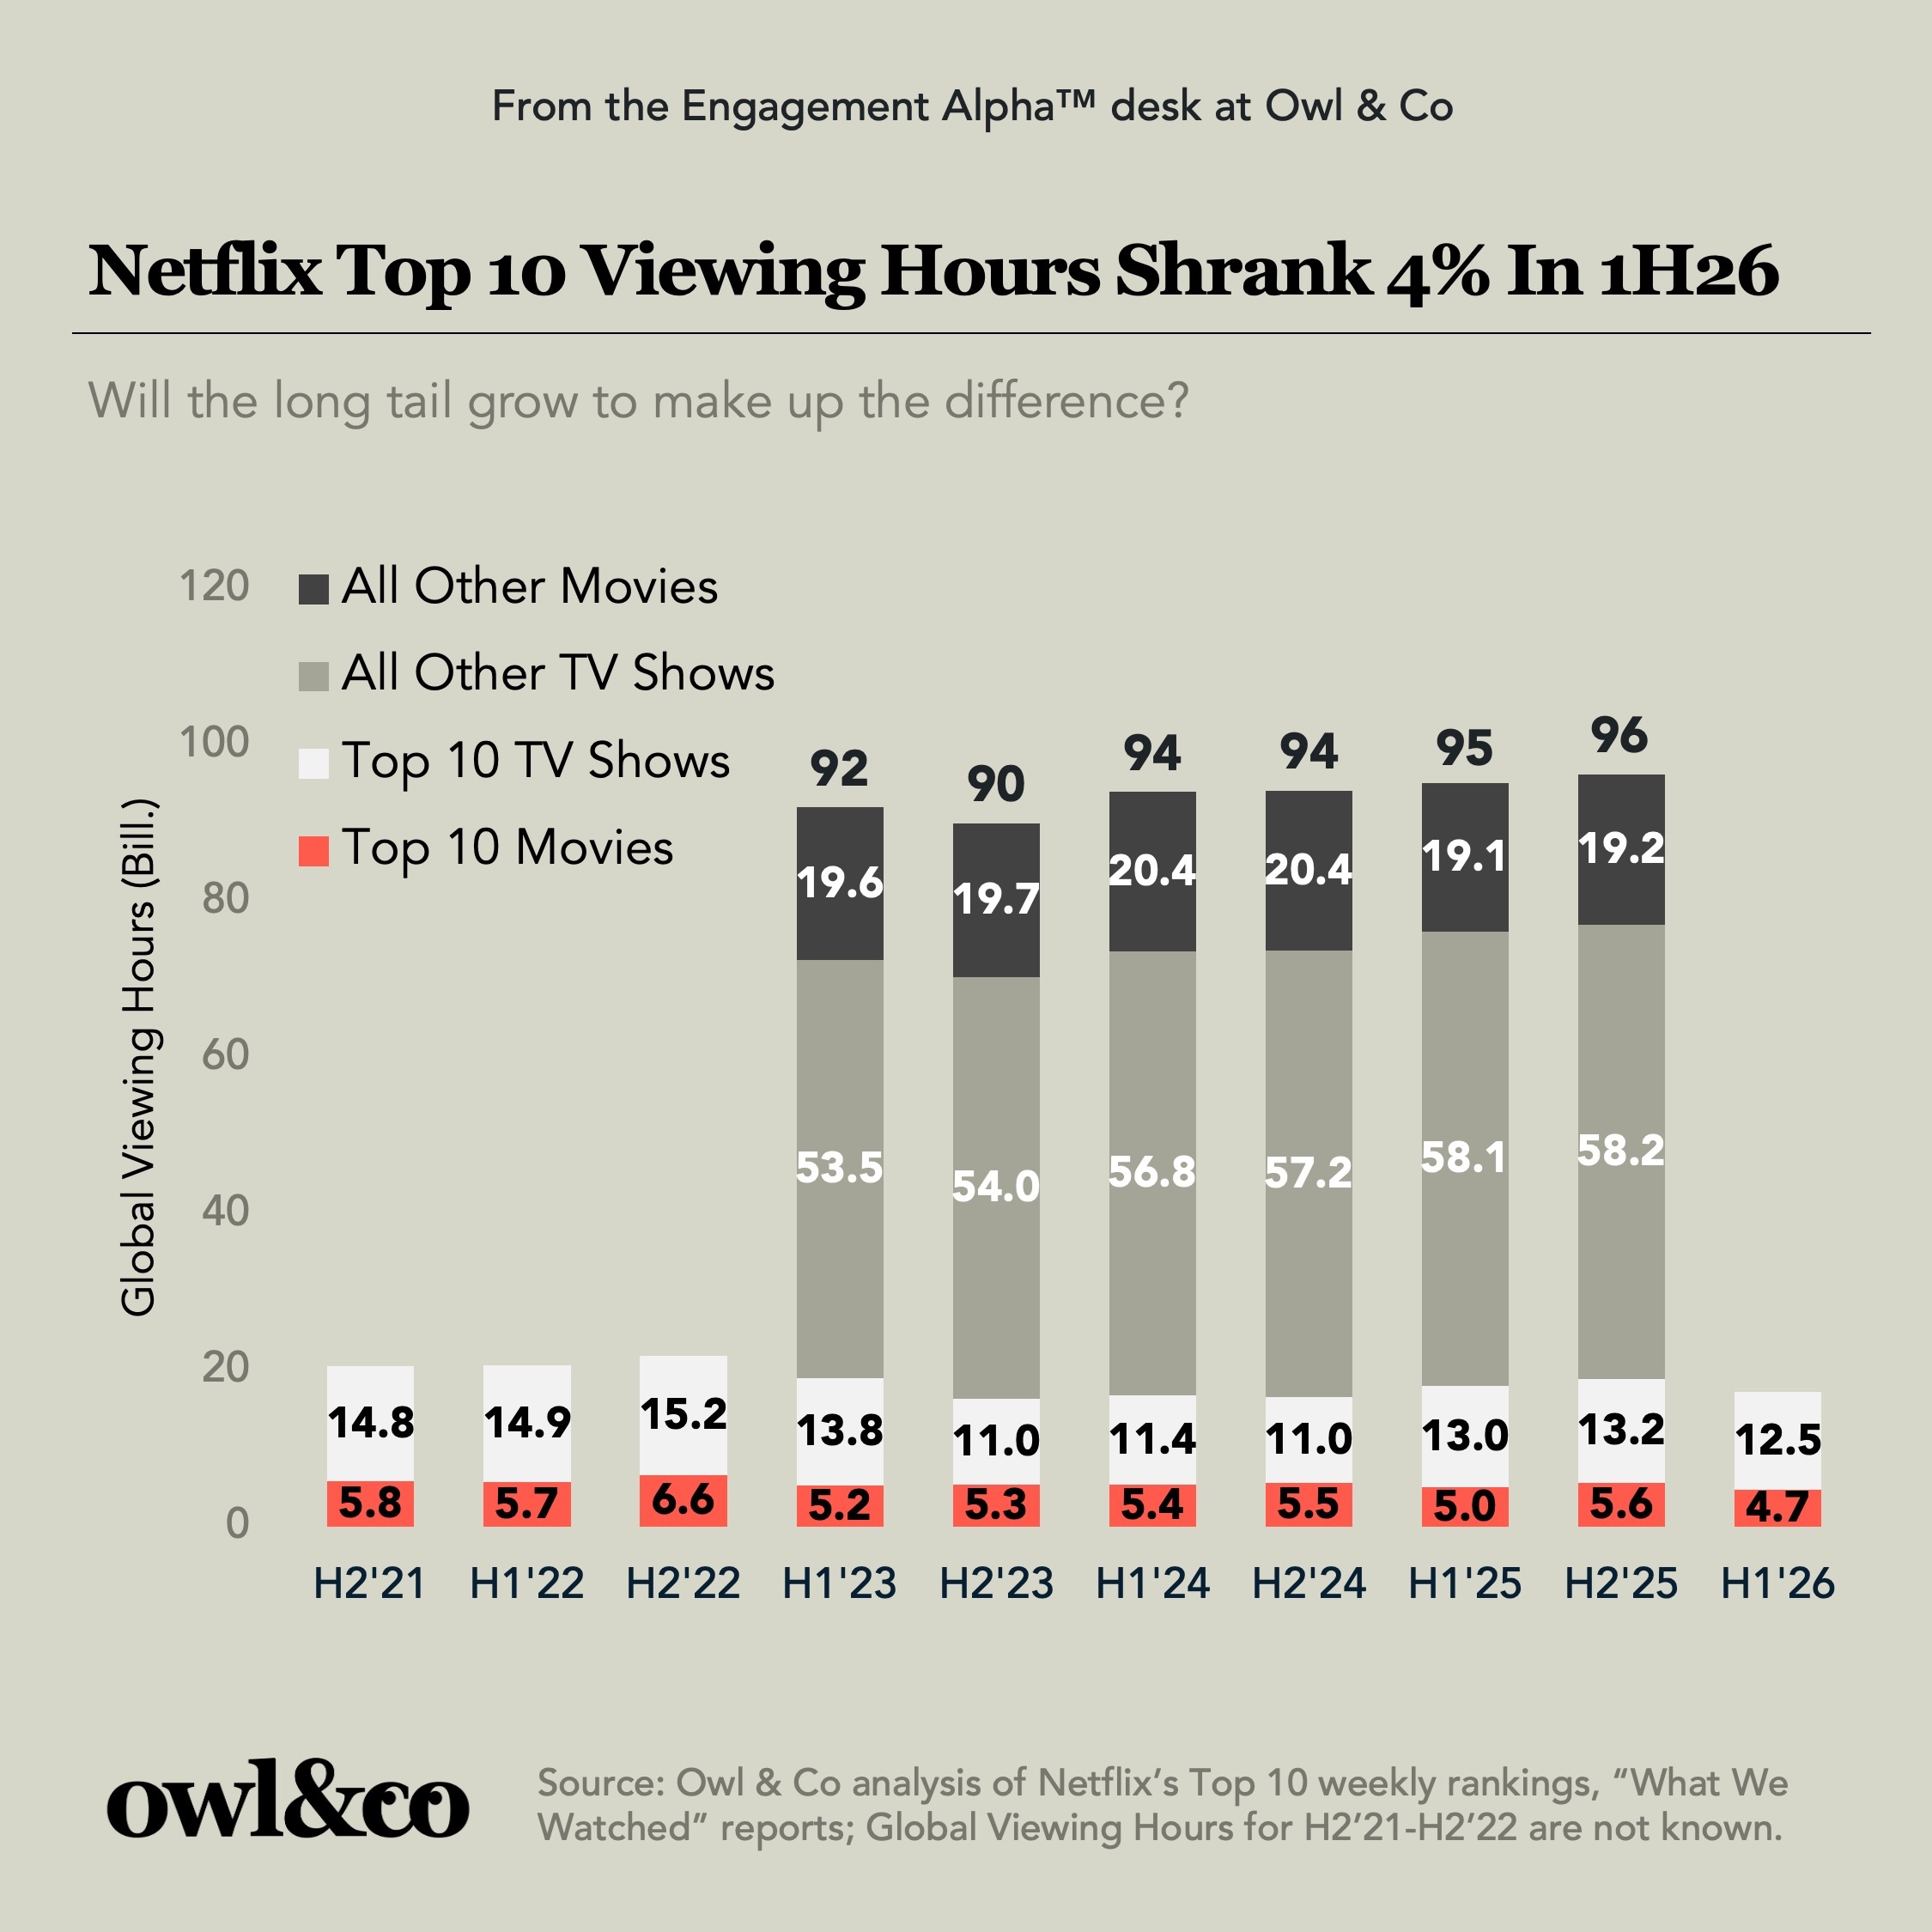
Versions of this question have circulated around both the Hollywood and investment community since early in the quarter. The company had batted away concerns about engagement with ever-increasing revenue and profits until its last earnings report. But sentiment shifted: “Netflix has the feel of a fallen angel: Its forward P/E is -2 Standard Deviations below the ‘23-current average. Investors are worried about engagement slowing as a harbinger or long-term rev growth slowing too, which ostensibly justifies the derating,” said Wells Fargo’s Steven Cahall on an ultimately bullish July 1st note. “While cheap isn’t a thesis, it certainly makes us more interested in the bull/bear EPS setup.”
As everyone knows, Netflix has had other routs with investor sentiment only to come back stronger...